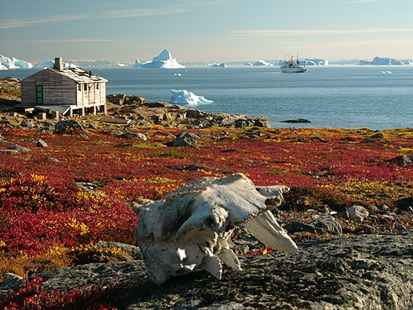
⛳ Pituffik/ Thule Air Base is situated in or near the polar desert biome.
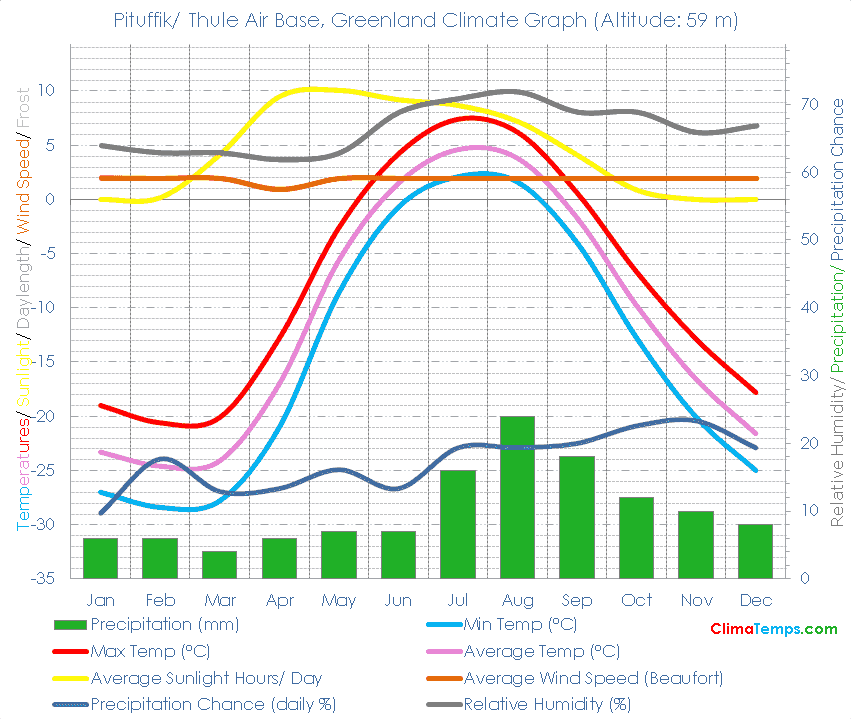
🌡️ The average annual temperature is -11.2 degrees Celsius (11.8 degrees Fahrenheit). See the temperatures page for a monthly breakdown and the fixed scale graph.
🐬 Average monthly temperatures vary by 29.2 °C (52.6°F). This indicates that the continentality type is continental, subtype truly continental.
☔ Total annual precipitation averages 124 mm (4.9 inches) which is equivalent to 124 Litres/m² (3.04 Gallons/ft²).
Simply paste the following HTML code into your webpage. Please include a link back to this website. There is one in the following code already. Edit the width attribute to change the size of the graph if needed:
🐇Were you to burrow down through the centre of the Earth from Pituffik/ Thule Air Base you would pop up nearest to the climate station at Mcmurdo Sound, Antarctica where you would find a Ice Cap climate.
🌍Pituffik/ Thule Air Base, Greenland is at 76°31'N, 68°45'W, 59 m (194 ft). Check the location on the map.
| Climate Variable | Jan | Feb | Mar | Apr | May | Jun | Jul | Aug | Sep | Oct | Nov | Dec | Annual | ||
|---|---|---|---|---|---|---|---|---|---|---|---|---|---|---|---|
| Average Max Temperature °C ( °F) | -19 (-2) | -21 (-5) | -20 (-4) | -13 (9) | -3 (27) | 4 (40) | 7 (45) | 6 (43) | 1 (33) | -7 (20) | -13 (9) | -18 (0) | -8 (18) | ||
| Average Temperature °C ( °F) | -23 (-10) | -25 (-12) | -24 (-11) | -17 (1) | -6 (22) | 2 (35) | 5 (40) | 4 (39) | -2 (29) | -10 (14) | -17 (2) | -22 (-7) | -11 (12) | ||
| Average Min Temperature °C ( °F) | -27 (-17) | -28 (-19) | -28 (-18) | -21 (-6) | -9 (17) | -1 (31) | 2 (36) | 2 (35) | -4 (25) | -13 (9) | -20 (-4) | -25 (-13) | -14 (6) | ||
| Average Precipitation mm (in) | 6 (0) | 6 (0) | 4 (0) | 6 (0) | 7 (0) | 7 (0) | 16 (1) | 24 (1) | 18 (1) | 12 (0) | 10 (0) | 8 (0) | 124 (5) | ||
| Number of Wet Days (probability of rain on a day %) | 3 (10) | 5 (18) | 4 (13) | 4 (13) | 5 (16) | 4 (13) | 6 (19) | 6 (19) | 6 (20) | 7 (23) | 7 (23) | 6 (19) | 63 (17) | ||
| Average Sunlight Hours/ Day | 0h 00' | 0h 10' | 4h 07' | 9h 48' | 10h 03' | 9h 30' | 8h 40' | 7h 11' | 4h 14' | 0h 52' | 0h 00' | 0h 00' | 4h 34' | ||
| Average Daylight Hours/ Day | 0h 50' | 3h 00' | 11h 21' | 19h 16' | 0h 50' | 0h 50' | 0h 50' | 22h 33' | 14h 05' | 6h 05' | 0h 50' | 0h 50' | 12h 00' | ||
| Sun altitude at solar noon on the 21st day (°). | -6.3 | 3.3 | 13.9 | 25.5 | 33.8 | 36.9 | 33.9 | 25.5 | 14.1 | 2.9 | -6.5 | -9.9 | 13.9 |
Please take a moment to share a climate graph or simply the address:
Thank You, so much! ❤️